Fiddler is a useful tool when debugging applications that use HTTP/HTTPS. It can be particularly helpful when you need to show whether a problem lies with the client or with the server. Server support people tend to be confident that the problem is on the client; client support is certain the problem lies on the server; sometimes they get together and agree to blame the network.
You can use Fiddler to help show whose problem it is. Then you can beat up on the right party, to get them to fix the issue.
This is a tutorial on how to use Fiddler to capture HTTPS traffic. You should follow along and do these steps on your own Windows PC.
The Short Form
Here’s an overview of some of the things we will be doing:
- Install Fiddler
- Ensure that we can do HTTP capture
- Enable HTTPS capture
- Accept the Fiddler certificate
- Capture HTTPS!
Install Fiddler
- Visit http://www.telerik.com/download/fiddler
- There are two versions of Fiddler: Fiddler 2 and Fiddler 4 (as of December 2014). Try Fiddler 4 first.
- Most of the time, it doesn’t make any difference which version you use. Fiddler 2 requires that you have Microsoft .Net version 2 installed on your PC. Fiddler 4 requires that you have Microsoft .Net version 4 installed on your PC. You probably have both. You can start by installing Fiddler 4. If it fails, then you can either try Fiddler 2, or just install Microsoft .Net version 4.
- This tutorial will refer to “Fiddler”. You may see “Fiddler 2” or “Fiddler 4” or “Fiddler” on your PC. Treat them as synonyms.
- Download it. Run the install.
- Ensure that Fiddler starts properly. Go to Start » All Programs, and click on Fiddler to start it.
Learn How to Capture HTTP First
Yes, I know you’re anxious to capture HTTPS. We need to walk before we run. (If you are an old pro at capturing HTTP with Fiddler, you can skip this step.)
For purposes of this tutorial, you should close other application and other browser tabs you are not currently using. If those applications use HTTP/HTTPS while you are running the tutorial, you will capture their output in Fiddler. This is OK, but it might confuse you because your output will be different than the tutorial.
- Start Fiddler (Start » All Programs » Fiddler) if it is not running.
That’s it. There is no step 2. When Fiddler is running, it is capturing HTTP – unless you tell it not to. Let’s prove it.
- Point your browser to http://www.google.com/about
- Look at the Fiddler window. You’ll see something a lot like this:
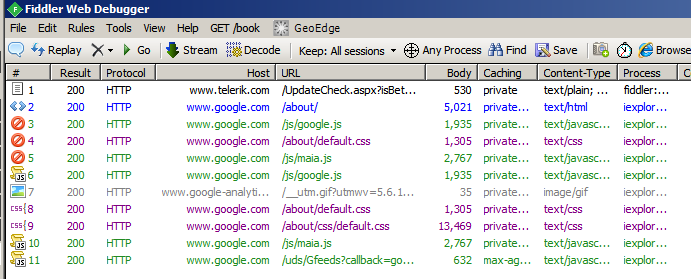
What can we tell from this?
- Row 1:
- Fiddler used HTTP to check with its web site, to see if there is a newer edition. (We’re guessing that, based on the URL column.)
- Result = 200. This means the web server sent HTTP status code 200, which is how web servers say, “OK. Did it. Success.”
- The process column tells you that “fiddler” is the name of the process that caused this request/response.
- Row 2:
- Per the Process column, Internet Explorer made the request.
- Per the Host and URL columns, IE fetched www.google.com/about/.
- Per the Protocol column, it used HTTP (i.e. http://www.google.com/about).
- Per the Result column, the server says it successfully responded.
- Per the Body column, the server sent 5021 bytes.
- Other rows:
- What’s all this other stuff? We asked for a simple web page, and we got lots of other transactions??!!
- This is normal. The web page that Google sent when you asked for the about page contains references to these other URLs, so IE went ahead and fetched them.
Let’s look at the ‘about’ transaction in more detail.
- Click on transaction #2 (www.google.com/about) on the left side of the window.
- Click on the Statistics tab on the right side of the window.
- See below
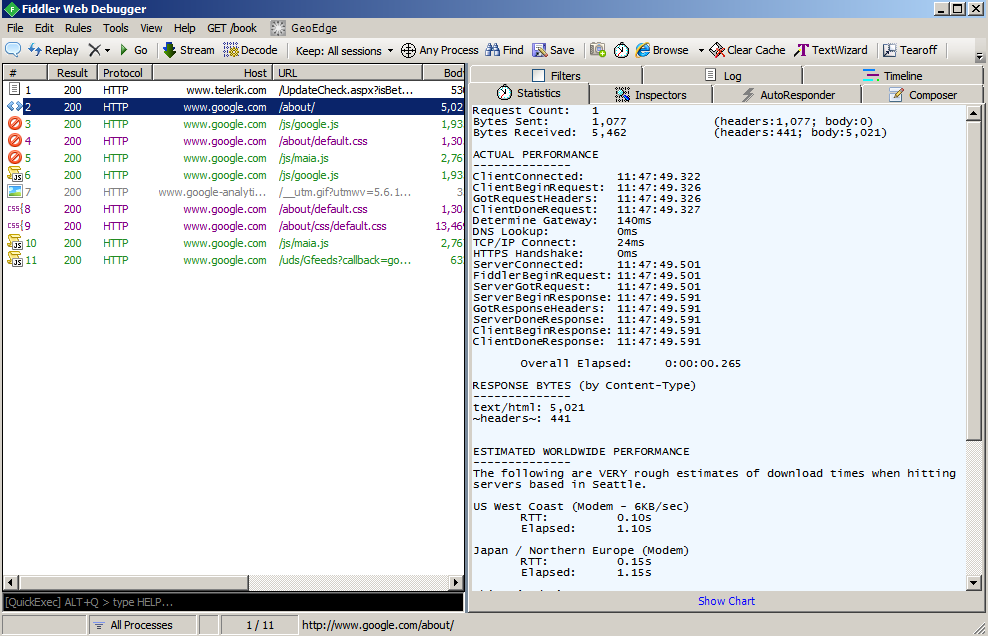
The numbers in your screen will be different. See if you can apply what I’m telling you about my screen shot with what you see on your Statistics tab.
- Bytes Sent: 1077 - The request from the browser was 1077 bytes of HTTP headers.
- Bytes Received: 5462 - The server replied to the request with 441 bytes of header and 5021 bytes of web page.
- ClientConnected: The browser made a TCP/IP connection to the server at 11:47:49.
- ClientBeginRequest: The client started sending its request at 11:47:49. This is immediately after making the connection. Sometimes you’ll see a ClientConnect that is much older than ClientBeginRequest. When this happens, the browser is re-using an existing connection.
- In the old days, every request/response cycle looked like: Connect, Send-request, Receive-response, Drop-connection.
- Then somebody got clever and said, “I can save some time by sending multiple request/response pairs to the same server on a single connection.” A connection will be established and left open until a time-out occurs, and a smart browser will re-use connections instead of creating a new one for each request.
- ServerConnected: Ah. I should mention that Fiddler is a proxy server. Your browser connects to Fiddler, and Fiddler relays the requests to the server (or to an upstream proxy server). In this case, Fiddler connected to the upstream proxy server a split second after the browser’s request.
- ServerGotRequest: This is when Fiddler thinks the server received the request.
- ServerBeginResponse: This is when the first byte of the server’s response was received.
- ServerDoneResponse: This is when the last byte of the server’s response was received.
- Overall Elapsed: This is how long the request/response cycle took. In the screen shot above, you’ll see that the whole transaction took about 1/4 of a second. Very fast. But this is only how long the ‘about’ page itself took. Remember that the page references other pages, and those pages also have to be fetched. They aren’t included in the 1/4 second.
Check the Timeline
- Select transactions 2-11 on the right side of the window. (Click on #2 and then shift-click on #11.)
- Click on the Timeline tab on the right side of the window.
You’ll see something much like the screen shot below.
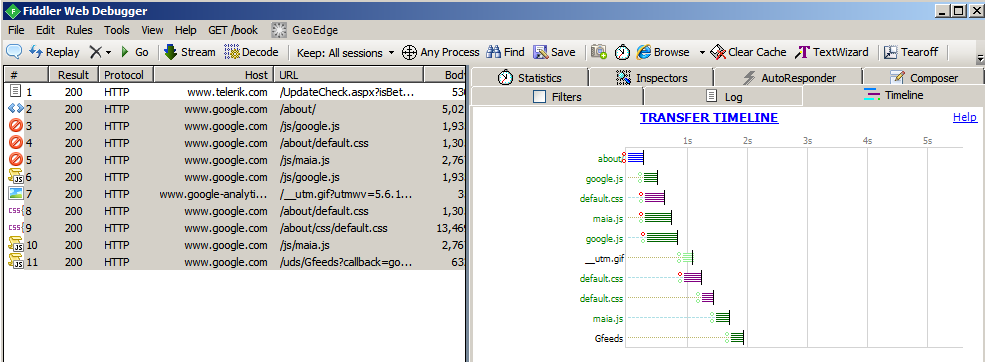
In the Transfer Timeline, you can see that the complete transaction took almost 2 seconds. The ‘about’ page took 1/4 second. It contained a reference to a google.js page, which looks like it took about another 1/4 second. It also referenced a default.css page, which took a little longer. Notice that the google.js and default.css downloaded in parallel. Neither one could start until the ‘about’ page finished loading, because that page referred to them, but once the ‘about’ page was loaded, the browser could see that it needed to download both of them, so it did so in parallel.
- Assignment: One of google.js/default.css reused the connection which was created to download the ‘about’ page. In order to operate in parallel, the other one had to open a new connection. Use the Statistics tab to see which of google.js/default.css re-used the old connection and which created a new connection.
- Hint: The ClientConnected value for the one that re-used a connection will match the ClientConnected value for ‘about’.
Looking at the full Transfer Timeline, you’ll notice that several transactions start at about the same time, while others look like one doesn’t start until the one before it completes. There are two things that can cause this:
- If one page refers to another, the second page won’t start downloading until the page that references it is downloaded. (Usually.)
- If the browser limits the number of concurrent connections (for example it may have a rule that says, “No more than 4 concurrent connections to the same server”) later transactions will have to wait for one of the earlier transactions to finish, in order to re-use one of the connections.
- Note: Most browsers permit configuration of the maximum connection count. Sometimes you can improve page load time by increasing the maximum. Sometimes you can crater the server, if you have 50 users all trying to hit the same server with a 20 connection limit, you could have 1000 connections all hit the server at the same time. This will hurt the server’s performance.
Looking Deeper
Let’s look at the ‘about’ page in more detail.
- Click on transaction 2 in the left side of the window.
- Click on the Inspectors tab on the right side of the window.
You’ll see something a lot like this:
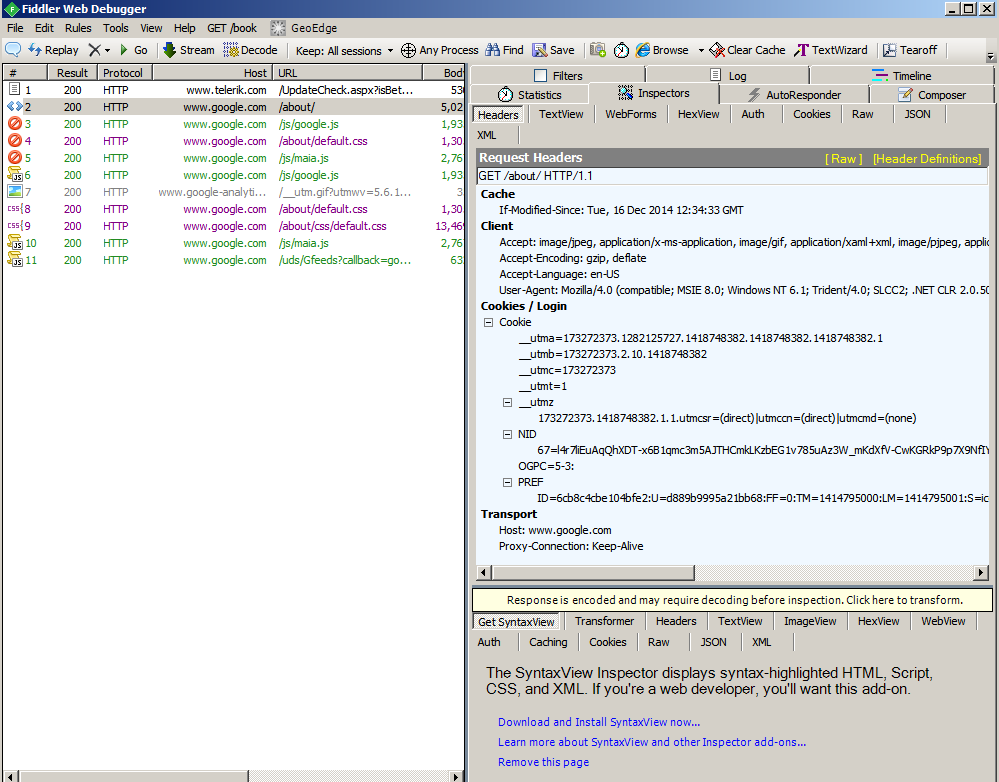
The first thing you want to do is click where it says, “Response is encoded and may require decoding before inspection. Click here to transform.” Go ahead and do it. I’ll wait…
OK. On the right side of the page, you’ll see two panels: Request Headers and Response Headers.
When the browser sends a URL, it also sends some ‘headers’. These are cleverly placed in the Request Headers” panel of Fiddler. When the server sends back a response, in addition to the web page itself, it also send back some headers. These are cleverly shown in the *Response Headers panel.
Looking at the Request Headers in the screen shot above (or in your own window, as you play along at home) you can see:
- The browser sent an HTTP GET request for /about/ and it told the server it would like to use HTTP version 1.1 (which supports connection re-use).
- Cache: The browser has a cache for this page, and the server should only send the page if it has changed since the prior copy was cached.
- Client: This tells the server about the browser.
- Our browser is prepared to accept certain types of content (JPEG images, applications, GIF images, etc.).
- Our browser tells the server it can handle gzipped pages. If the server gzips pages before sending them, they’ll move across the network faster, and the browser will unzip them before displaying them.
- The user likes US English. (Some servers are multi-lingual.)
- User-Agent: Despite the fact that it looks like it is telling the server that the browser is “Mozilla 4.0”, this really tells the server that I was using IE 8.0. This is just how browser identification works. It always starts by saying “Mozilla” and then the real browser info is provided in parenthesis.)
- Cookies: These are the cookies sent from the PC to the server.
- Transport: The interesting thing in this case is “Proxy-Connection: Keep-Alive”. This says that the browser would like to maintain a connection through the various proxies, all the way to the server. In other words, it is planning on re-using connections to send/receive multiple requests.
I’m not going to go into details on the Response Headers.
- Assignment: You explore the Response Headers. Use Google to find out what they are telling you. (Be sure to include “http response header” in your Google query.) Oh… There is a “Header Definitions” link in the Response Headers panel. You should be able to click on it to see the Fiddler site’s definition of the headers, but as of December 16, 2014, that page is broken and there’s nothing on the page!
Show Me the Response Body
- Click on the TextView tab on the right side of the window.
The lower panel will now show the full content of the web page as sent by the server.
I’m not going to go into detail on the web page. It is a web page with HTML, JavaScript, and references to other pages that have to be downloaded in order to render the page.
Stopping/Starting Capture
While you’re exploring a session, it can be annoying if Fiddler keeps capturing more transactions, causing the left panel to scroll.
- On the File menu, the first entry is “Capture Traffic”. When there is a check mark in front of “Capture Traffic”, Fiddler is capturing. Click on “Capture Traffic” to toggle capture on/off.
Where Are We? System Proxy and Other Tips
At this point, we can capture a basic HTTP session, we can explore the request and the response, and we can stop and start capture. It doesn’t matter whether the HTTP session comes from Internet Explorer, Firefox, or Java – so long as the browser or Java is configured to use the Windows-configured system proxy server.
- For Internet Explorer, it just works. Don’t mess with it.
- For Firefox, BEFORE you start Fiddler, look under Tools (menu) » Options » Network » Settings and be sure that “Use System Proxy Settings” is selected.
- For Java, BEFORE you start Fiddler, go to Control Panel » Java » General » Network Settings and select “Use browser settings”.
Don’t change proxy settings while Fiddler is running. Fiddler is a proxy server. When you start Fiddler, it will change your proxy settings to point to Fiddler for your proxy. If you had a proxy server set up before you started Fiddler, Fiddler will chain to that proxy server as the next step on the way to the web server.
Fiddler is just an HTTP/HTTPS proxy server that logs everything that passes through it.
Tip: Sometimes you want to clear stuff from the Fiddler capture log. Maybe you solved one problem and you want a fresh start for another problem. You could exit and restart Fiddler to clear the capture log. You could go to Edit (menu) » Remove » All Sessions. What I usually do is click on any transaction, press Control-A to select all transactions, and then press the Delete key on the keyboard.
Tip: Save your Fiddler log! If you quit Fiddler without saving, your log will be discarded. To save, go to File (menu) » Save » All Sessions.
Tip: Never, ever email a Fiddler log. Some email systems have an anti-virus plugin that will remove executable code from attachments. If any of your web pages have JavaScript in them (and most pages do have JavaScript), the anti-virus will rip it out of your Fiddler log, corrupting the log beyond redemption. Use a shared network folder, file upload service, USB flash drive, or instant messaging to transfer Fiddler files.
Configuring for HTTPS Capture
Sometimes you need to look inside HTTPS. HTTPS traffic is encrypted to prevent this from happening. We’re going to fool the browser (or Java) into thinking that Fiddler is the server. The browser will send encrypted data to Fiddler, Fiddler will decrypt it, log it, re-encrypt it, and send it to the server. The server will send encrypted data to Fiddler, Fiddler will decrypt it, log it, re-encrypt it, and send it to the browser (or Java).
In security circles, this is known as a “man in the middle attack.” Browsers and Java don’t like this. We’ll have to tell them to trust us. We’ll also have to tell Fiddler it is OK to do this.
Enabling Fiddler Decryption: Go to Tools (menu) » Fiddler Options » HTTPS. Enable both “Capture HTTPS CONNECTS” and “Decrypt HTTPS traffic”. If you want to decrypt solely browser traffic, choose “… from browsers only.” If you want to decrypt all processes, choose “… from all processes.” Java alert – Java might run inside the browser window, so if you need to capture Java, you’ll want “… from all processes.”
Honestly, I haven’t had a lot of success with “… from browsers only.” When you are running Fiddler, I recommend that you CLOSE ALL APPS besides the one you are testing, and use “… from all processes.”
The first time you do this, Fiddler will ask you:
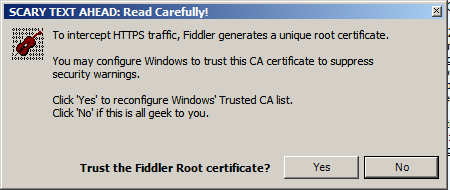
Yes, you do want to trust Fiddler.
Because this is security, you’ll get asked again:
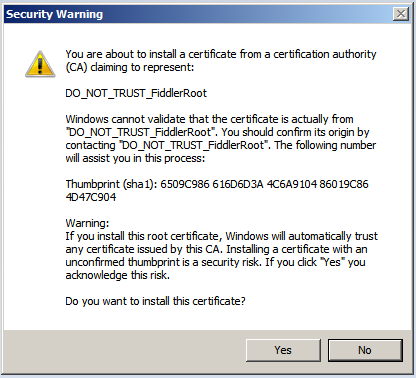
Yes, you do want to install the certificate. This is how Fiddler pulls off decryption. You have to tell the browser to trust Fiddler.
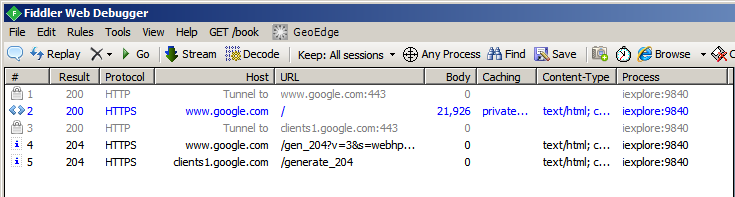
Let’s see it work. After you enable decryption (and, if you turned off capture, turn it back on), point you browser to https://www.google.com. Here’s what that looks like in Fiddler:
Let’s look at that is some detail. (Reminder: You should do this tutorial, not just read it. Look at your Fiddler results, in addition to mine.)
- #1 - The browser connected to port 443 at Google, to set up an encrypted connection. This should make everything that goes inside the tunnel private and un-readable by anyone except Google. Result = 200 indicates that it succeeded.
- #2 - The browser then sent a request for the page named “/” at www.google.com, via that tunnel. Result = 200 indicates that the server sent back a page successfully.
- #3 - The browser then opened another encrypted connection. This one went to clients1.google.com. (The “/” page probably has a reference to https://clients1.google.com.) Result = 200 indicates that it succeeded.
- #4 - The browser sent another request to www.google.com. This one was for the page named “/gen_204?v=3&s=webhp…”. Result code 204 indicates a special kind of success. It says that the server successfully handled the request, and the server sent back some headers, but there will be no page content. This URL was probably a tracking URL. It told Google something about you or about your PC, but the Google search page that will be shown in your browser was not altered in response to this URL.
- #5 - The browser sent a request to clients1.google.com (over the second tunnel). As with #4, Google sent back a success indicator and headers, but no page body.
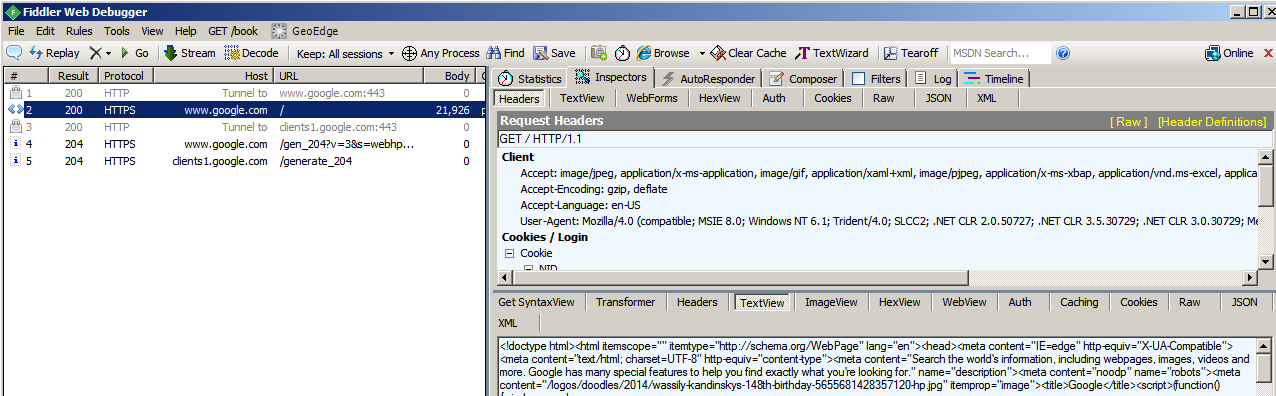
But Did We Decrypt?
- In the left side of the window, click on the transaction for https://www.google.com/ (in my screen shot, it is #2).
- In the right side of the window, click on TextView. (If it tells you that you need to ‘click here to decode’, do so.)
If you decrypted successfully, you’ll see the web page for www.google.com/ in the lower panel. See example below:
Java and HTTPS
I’m assuming that you have a Java applet that runs inside your browser. Stand-along Java apps are not included in this tutorial. Depending on how your applet is written, you may need to tell Java to trust the Fiddler certificate. Here’s how to tell Java:
- Start Fiddler
- Go to: Tools (menu) » Fiddler Options » HTTPS » Export Root Certificate to Desktop
- Go to: Windows Start Menu » CPanel » Java » Security » Manage Certificates » Import
- Import from FiddlerRoot.cer from your Desktop folder.
- Close/OK to get rid of the windows you passed through.